Fair Fare.
A Spatial Data Science Approach to Adaptive Transit Pricing
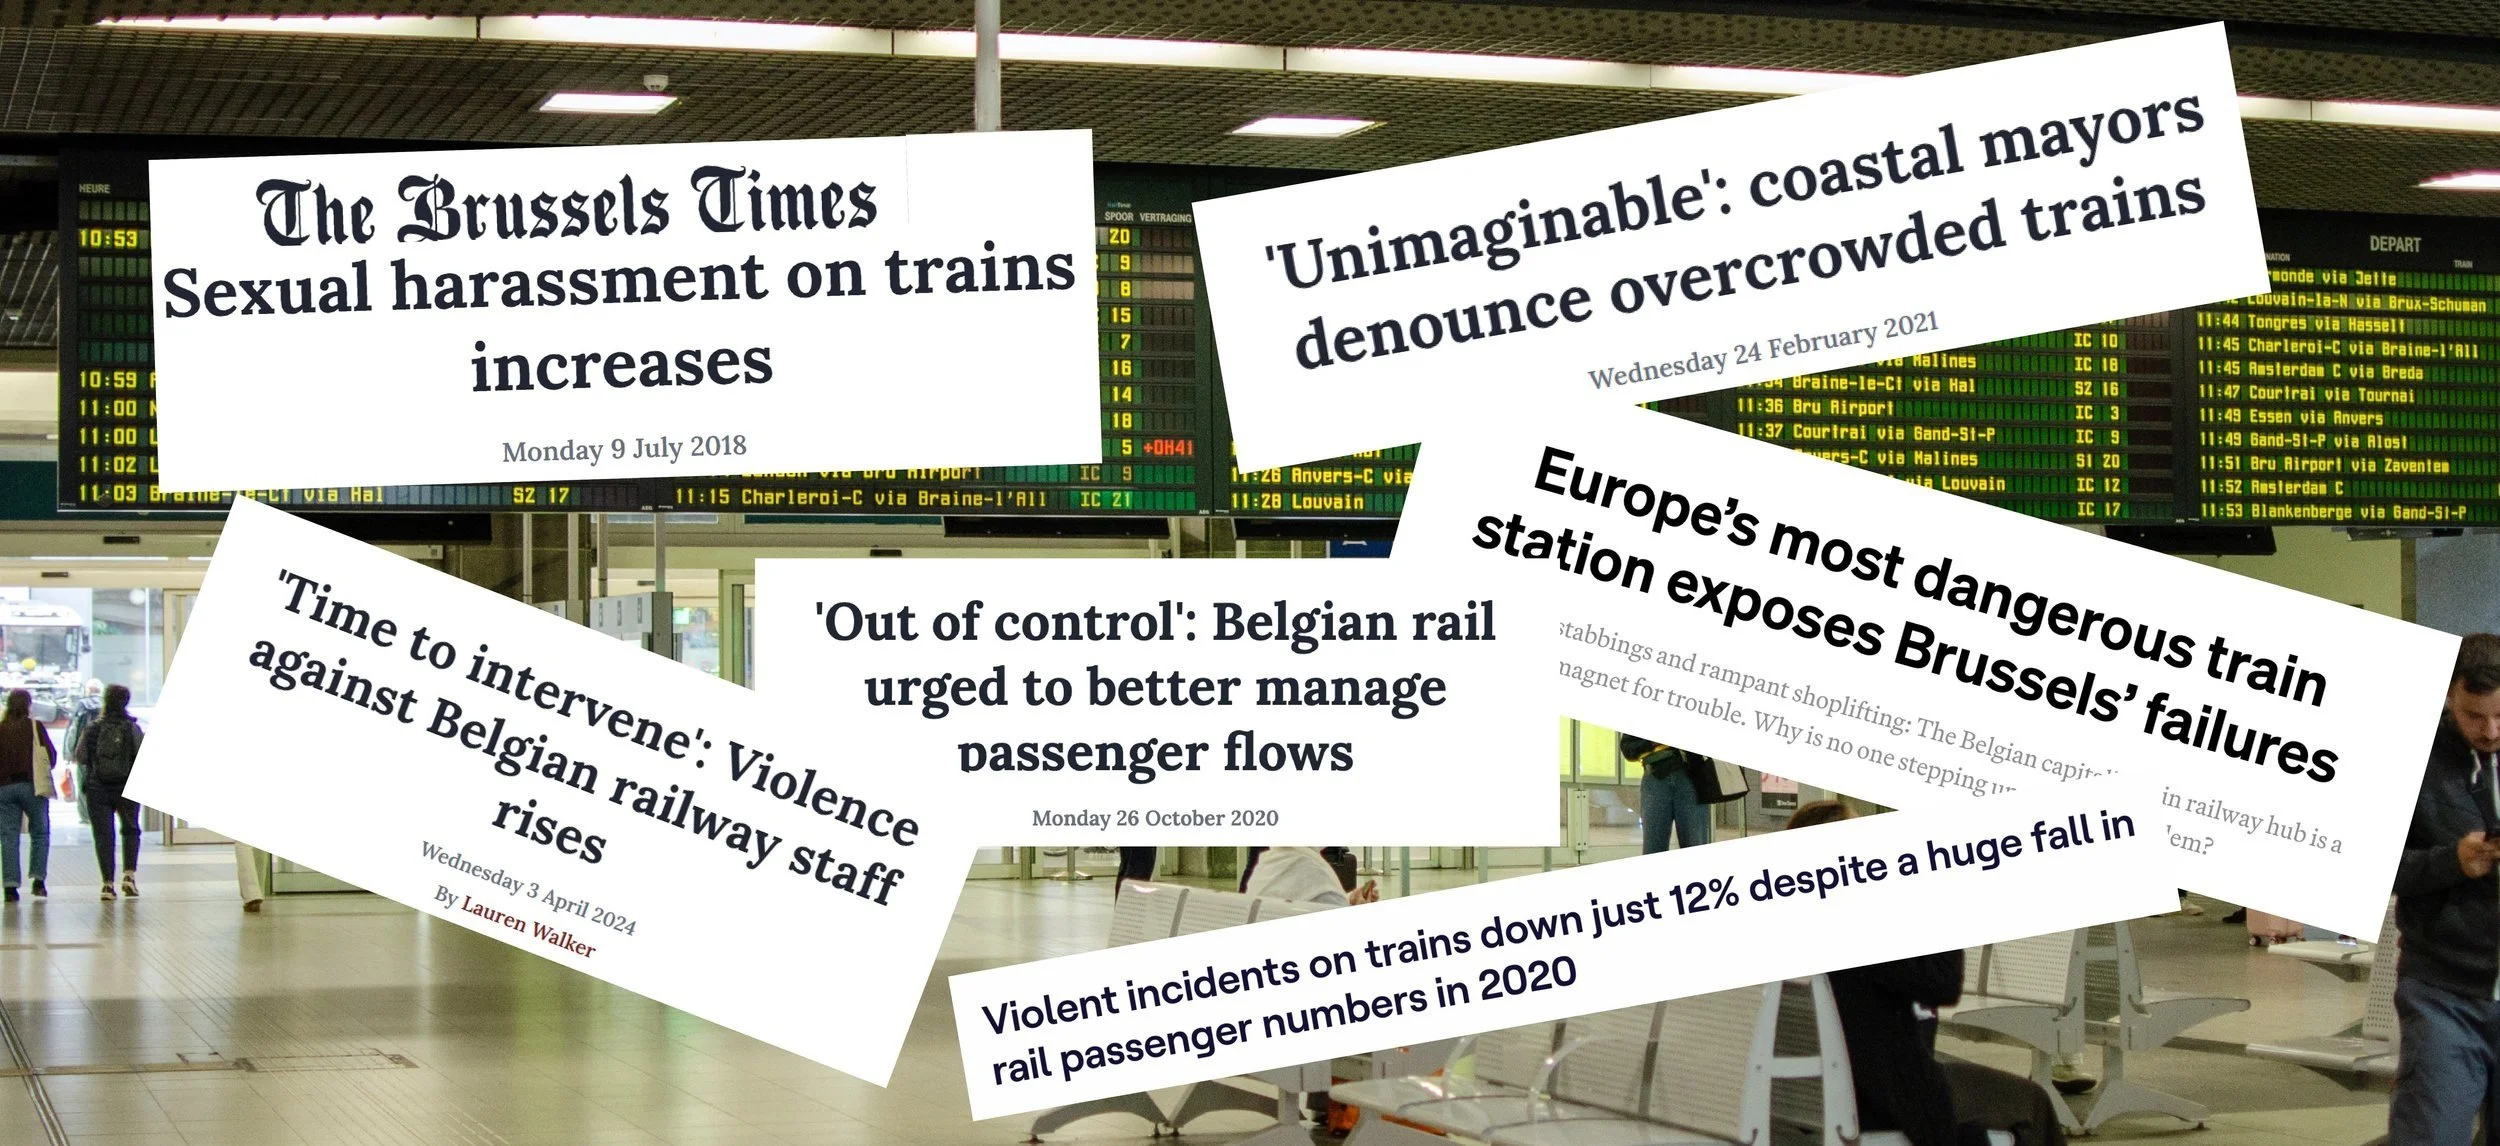
Belgium’s public transit operates on fixed fares, failing to account for real-time demand fluctuations.
This results in overcrowding during peak hours, underutilized off-peak services, and limited incentives for passengers to adjust their travel behavior.
Can dynamic, data-driven pricing create a more efficient, balanced transit system?
We designed an adaptive fare pricing dashboard using Belgian transit open data, optimizing UX with real-time fare adjustments, demand forecasting, and equitable pricing insights.
Goals
Increase operational efficiency in public transport.
Use pricing incentives to shape commuter behavior.
Ensure equitable, data-driven policy decisions for urban mobility.
This project highlights the intersection of spatial data science, behavioral economics, and design thinking—demonstrating how cities can move toward smarter, more adaptable transit systems.
How does it work?
Using a multinomial logistic regression model, train occupancy is predicted at high, medium, and low levels.
Ticket prices are dynamically adjusted based on train occupancy:
Lower occupancy results in lower ticket prices.
Transit riders can view projected train occupancy and corresponding dtnamic prices within the app.
higher prices discourage overcrowding by encouraging riders to opt for less crowded trains, effectively resdistributing passenger loads.
Discover
Occupancy (high, medium, low)
Weather (temperature, precipitation and wind gusts)
Stations (locations, names, average stop times)
Engineered features: time lags, spatial lags and space time lags
Validation
Tested across regions, income groups, and population density for generalizability.
Performed well in urban areas, with slight under performance in low-income rural regions
Feature Importance
Top predictors: Hour of the day, spatial lag and teamperature.
Temporal and spatial interactions significantly influenced predictions.
How did the model do?
The model achieved 67% accuracy, performing well at predicting low and high occupancy levels but requiring refinements for mid-range cases.
Peak-hour trends, spatial demand shifts, and temperature effects were the strongest predictors.
Accuracy was highest in urban, high-density areas, aligning with known ridership behaviors.
While time-of-day remained dominant, incorporating real-time sensor data could improve short-term forecasting.
Next Steps & Future Applications
Real-time integration of IoT-based train occupancy sensors for more responsive pricing.
Pilot studies and behavioral research to assess commuter responses to dynamic pricing.
Transparent pricing interfaces to ensure public trust and ease of adoption.
Why This Matters
Fair Fare showcases how spatial intelligence and predictive analytics can drive smarter transit planning. Dynamic pricing, when paired with real-time data and user-centered design, can help build a great tool for people and agencies.


